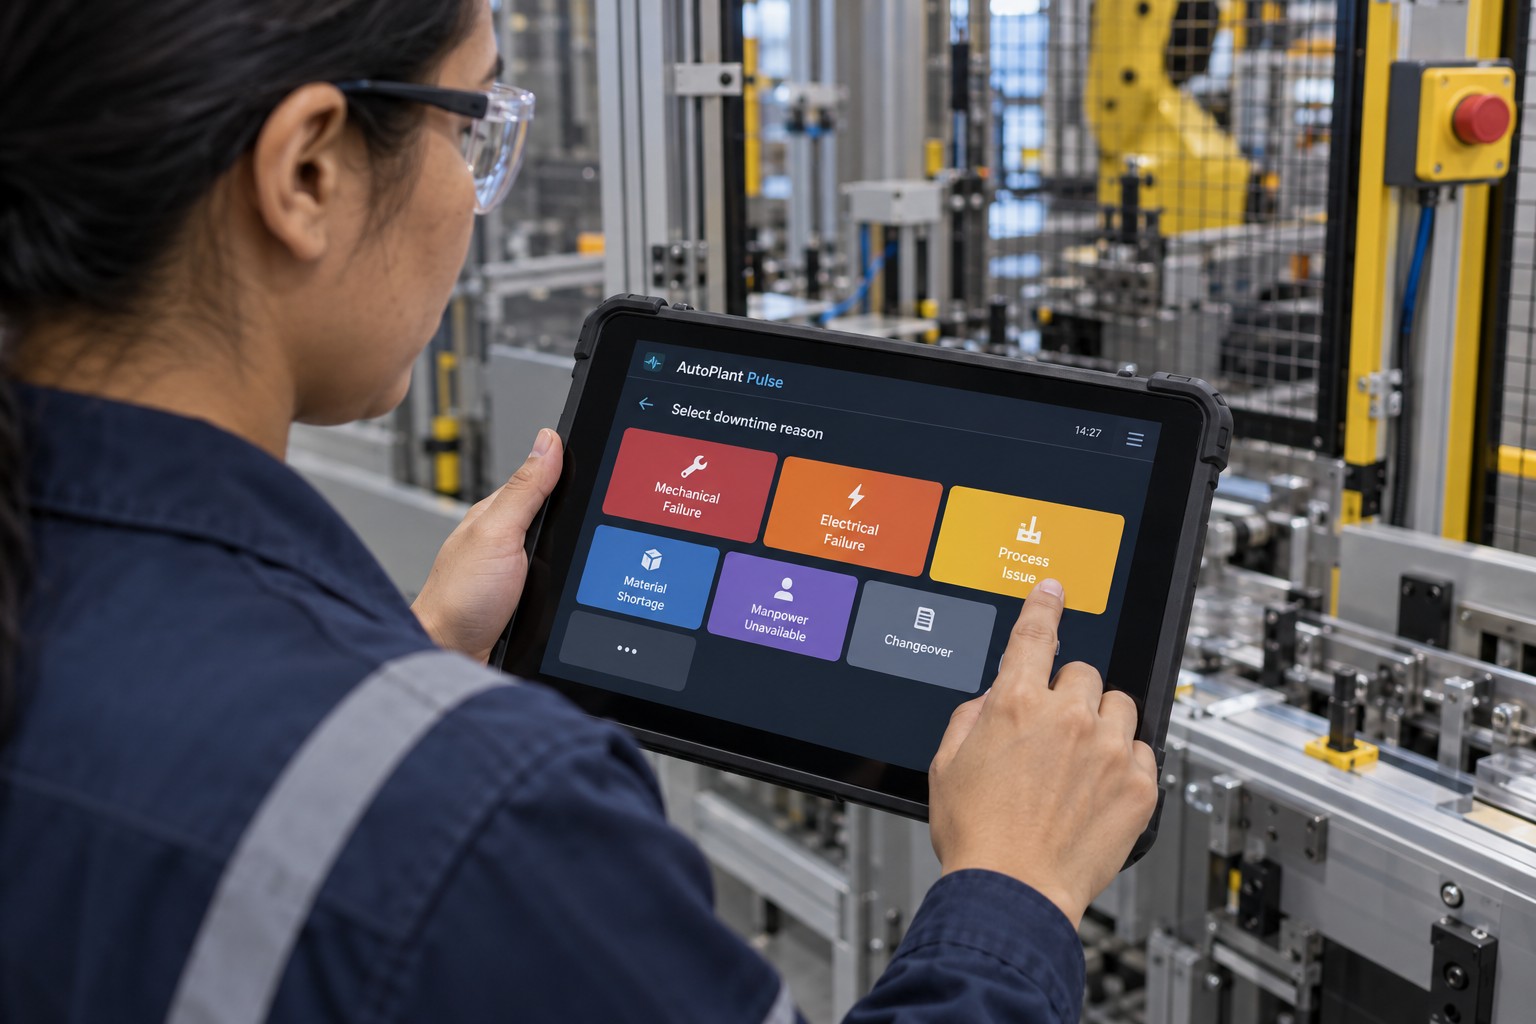
01 / OPERATIONS
Context for every stoppage.
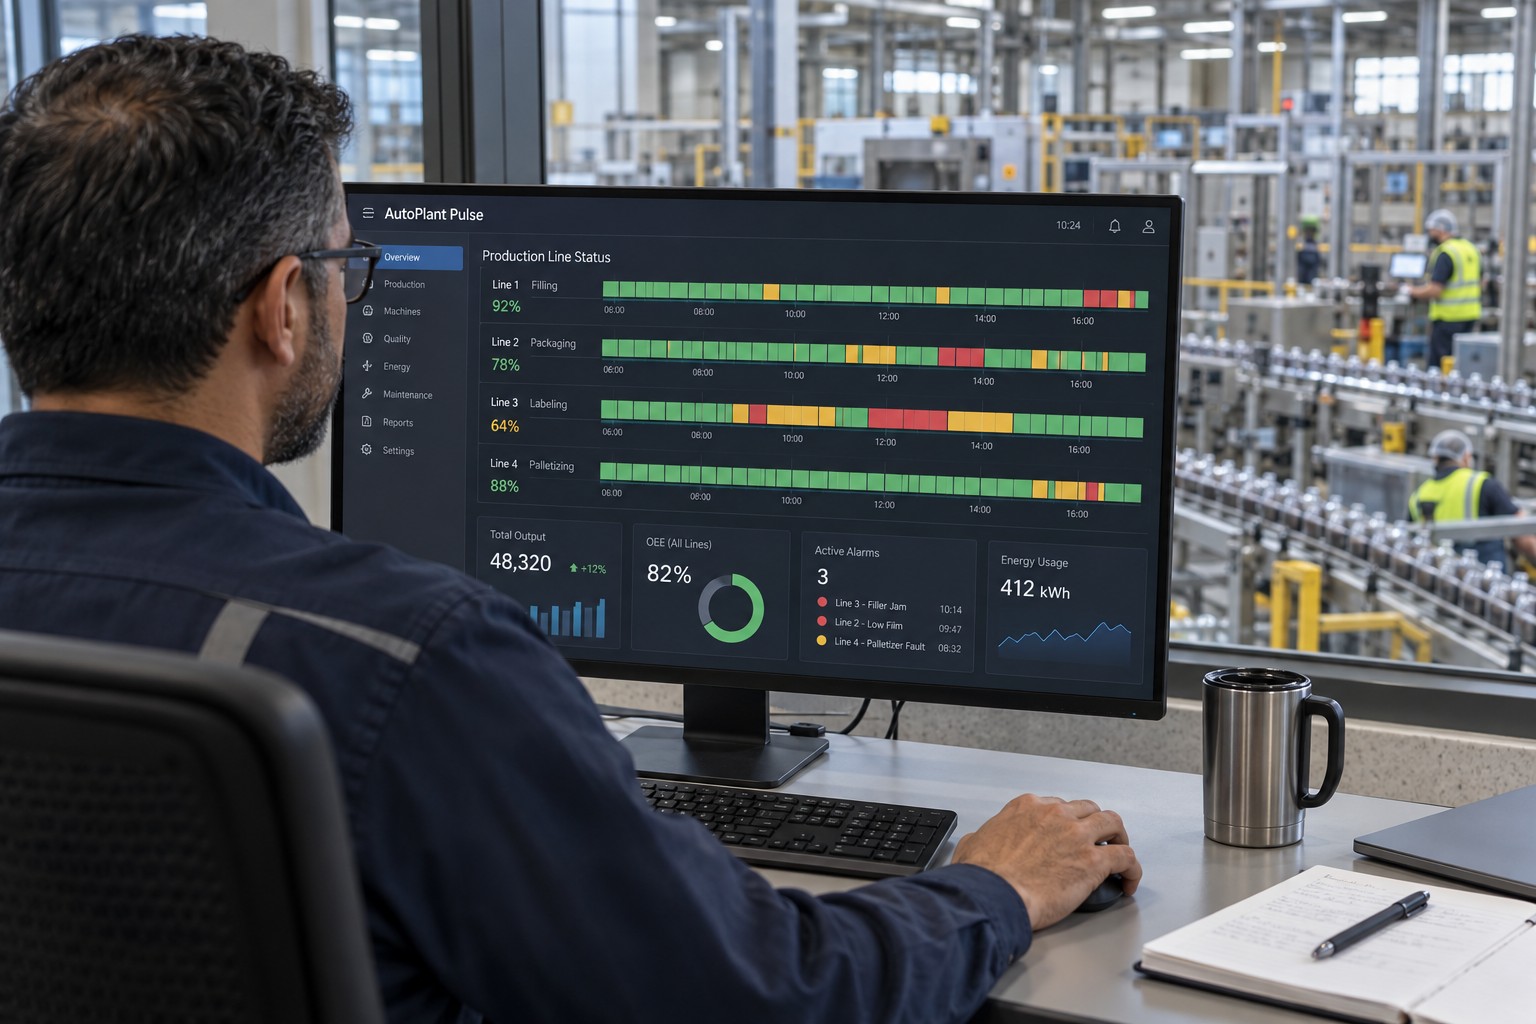
Operators record downtime reasons on a tablet beside the line. Managers follow the timeline to understand where time is lost.
 AutoPlantPULSE
PRODUCTION · TEAMS · MAINTENANCE
Connect what happens on your machines with the work of your teams. From production timelines to maintenance planning, give every decision the context it needs.
MONITOR → UNDERSTAND → IMPROVE
Production + technical expertisePULSE IN EVERYDAY OPERATIONS
See how operators, planners and managers can use the solution. Workflows and configuration are defined for each project.
01 / OPERATIONS
Operators record downtime reasons on a tablet beside the line. Managers follow the timeline to understand where time is lost.
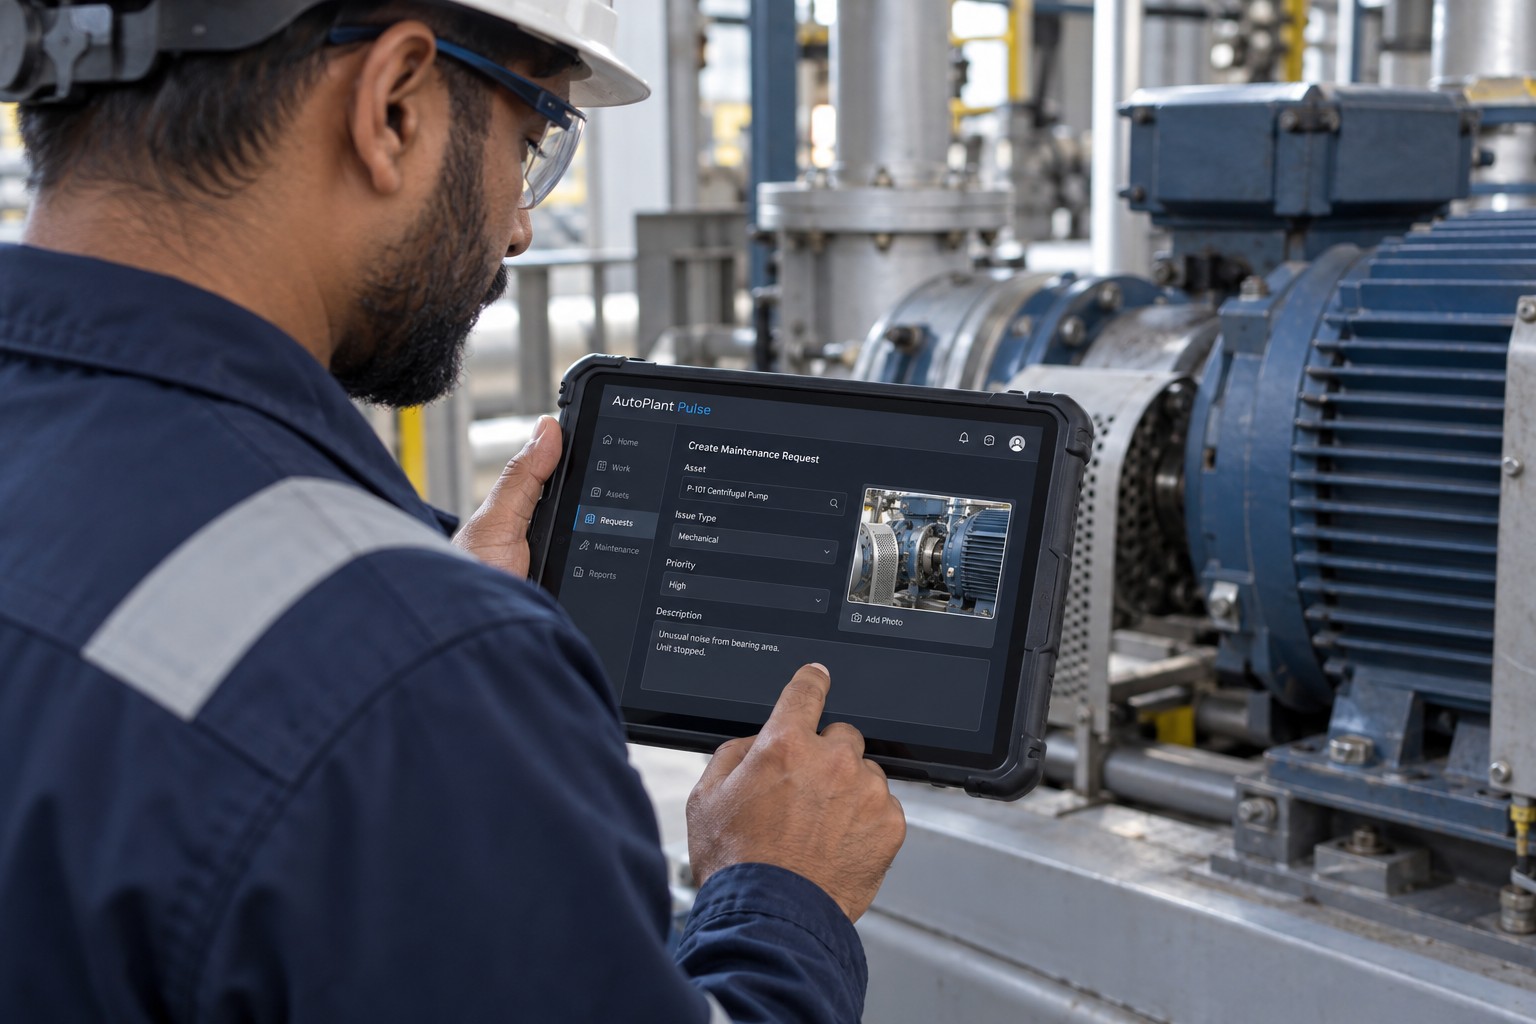
02 / MAINTENANCE REQUESTS
Technicians create requests beside the equipment and capture the information needed to follow up on the work.
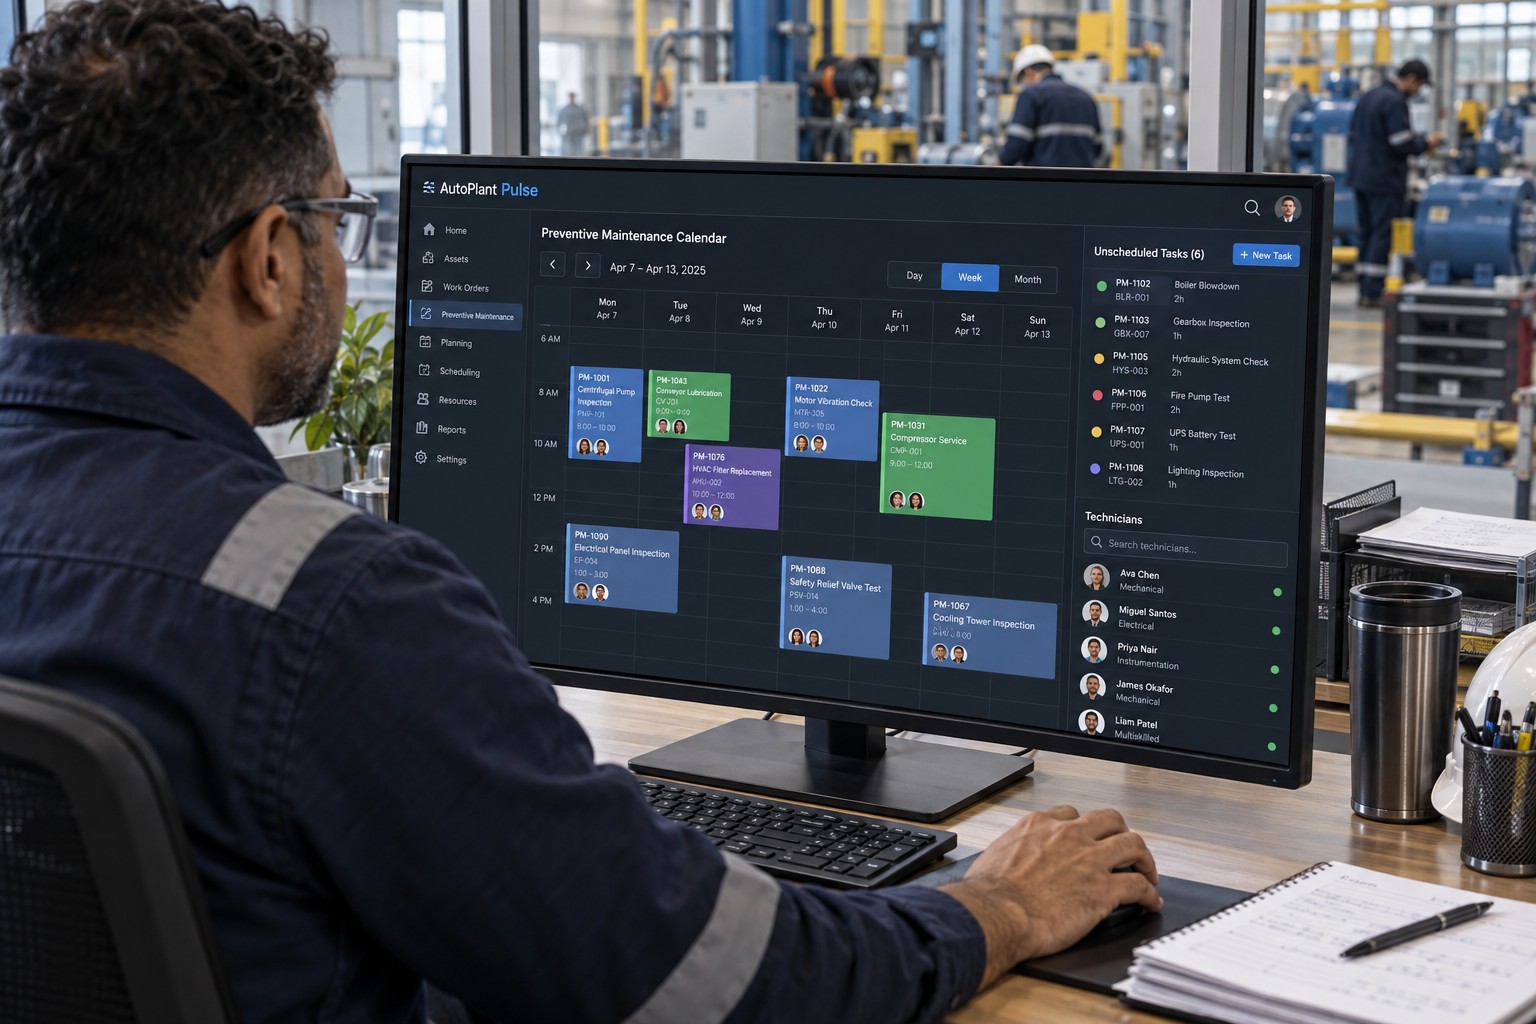
03 / PLANNING
The maintenance planner organizes preventive maintenance, assigns tasks and follows the work scheduled for each team.
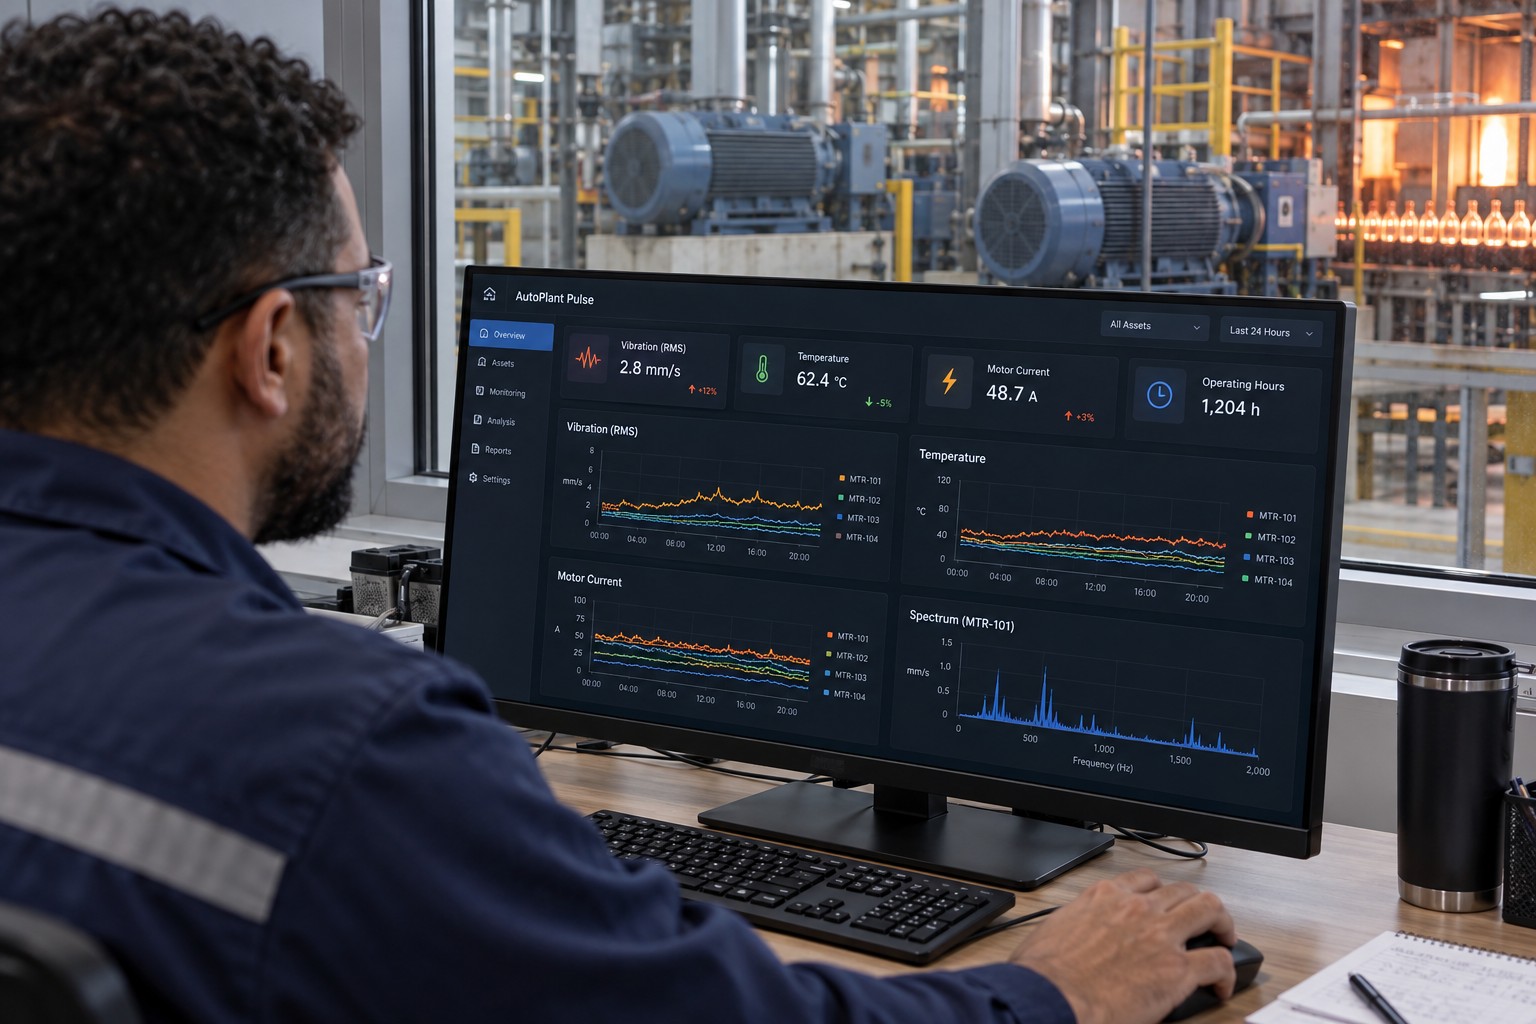
04 / ASSET CONDITION
The supervisor monitors motor measurement trends and identifies changes to help prioritize maintenance.
Illustrative AI-generated images. Screens show usage concepts.
EXPLORE PRODUCTION
Explore an example of production, downtime and speed losses. Switch between lines to try the demonstration.
Explore monitoring ↓Machine adjustment 18 min
Material shortage 12 min
Other 6 min
Illustrative example · Not connected to equipment or live data
TECHNOLOGY WITH PURPOSE
From signals on the factory floor to information on screen: connecting production, people and maintenance to understand what is happening and prepare the next action.
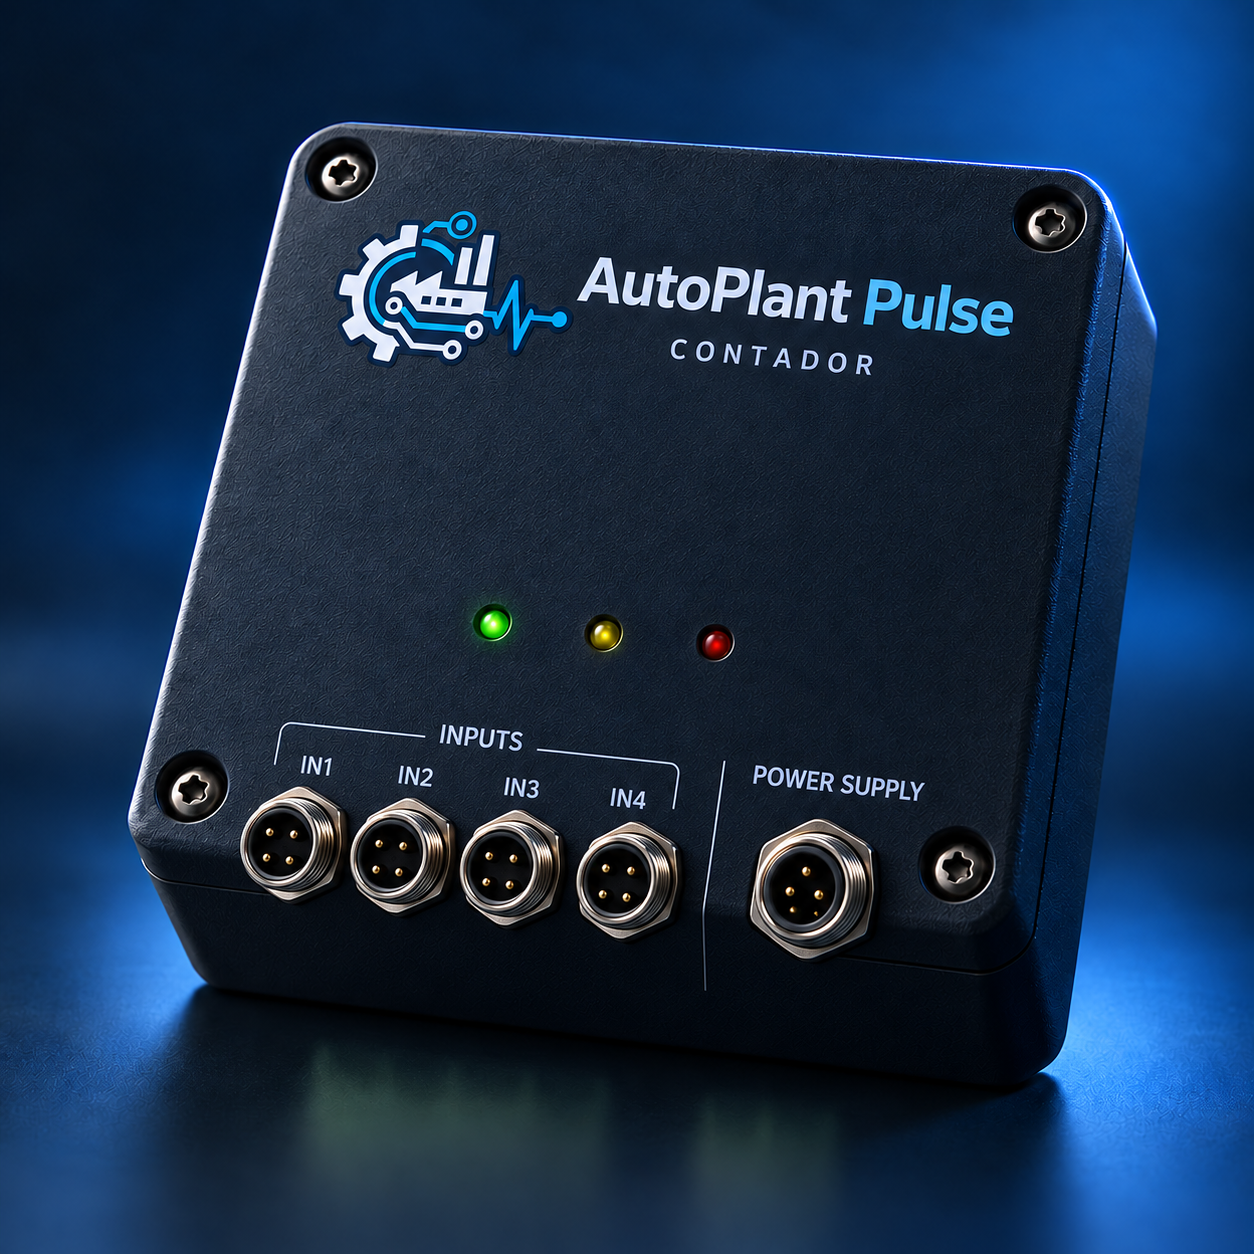
COLLECT
The counter represents the collection point for production pulses. Sensor connectors and the power connector are identified on the device.
ORGANIZE
Pulse brings production, downtime and maintenance records into an organized view. The counter connection is defined and validated for each project.
DECIDE
Managers review timelines, operators add context to stoppages, and maintenance teams follow requests, plans and trends.
01 / PRODUCTION MONITORING
AutoPlant Pulse brings operations and management closer, with organized information about what is happening and what happened during each shift.
Check production status and identify interruptions without relying solely on observation on site.
Explore the timeline and downtime reasons to understand where lost time is concentrated.
Use dashboards to track indicators and support discussions between production, maintenance and management.
HOW IT WORKS
The solution starts with understanding your process and the signals available.
Identify equipment, objectives and data collection conditions.
Define signal connections and the appropriate configuration following technical validation.
View production, put downtime in context and explore the dashboards.
EXPLORE PULSE
From a line overview to the details of a shift. Explore sample dashboards and see how information gains context.
OVERVIEW
1 248 units
986 units
812 units
Illustrative states. Reduced-speed time is included in production time. Thumbnails show schematic trends.
UNDERSTAND LOSSES
Machine adjustment accounts for 50% of downtime in this example.
40 min
Time when the line is still producing, but at a speed below the reference.
Included in the 6 h 24 of production. Not added to downtime.
A discussion with more context. Distinguishing stoppages from speed losses helps identify what needs attention in each process.
COMPARE TO UNDERSTAND
Illustrative absolute values, not normalized by product or production rate.
8-hour shifts. Reduced-speed time is included in production.
Compare with context. Product, process conditions and shift duration should be considered when analyzing the numbers.
MAINTENANCE & RELIABILITY
Explore analytical concepts linking failures, repairs, equipment effectiveness and asset condition.
FAILURES AND RECOVERY
| Asset | Failures | MTTR | MTBF |
|---|---|---|---|
| Motor M01 | 2 | 2 h | 90 h |
| Pump B02 | 1 | 1.5 h | 150 h |
| Conveyor T03 | 2 | 2.25 h | 60 h |
Operation: 180 + 150 + 120 h. Repairs: 4 + 1.5 + 4.5 h. Overall indicators are calculated from totals, not a simple average of ratios.
Repair time ÷ number of failuresHelps understand the recovery effort after a breakdown.
Operating time ÷ number of failuresHelps track failure frequency in repairable assets.
Defining the period, what counts as a failure, and the start and end of a repair is essential for comparing values.
OVERALL EQUIPMENT EFFECTIVENESS
Availability × Performance × Quality
Adjust the three components to see the effect on OEE. These values do not represent any actual line or customer.
MAINTENANCE STRATEGY
Preventive24 jobs75%
Corrective8 jobs25%
JobsShows the distribution of completed jobs.
Work hoursShows the team's effort. These hours do not necessarily equal machine downtime.
In this example, preventive maintenance accounts for 75% of jobs and 60% of hours. The distribution alone does not demonstrate effectiveness or savings.
ASSET CONDITION
7 fictional samples. The reference is illustrative only and is not a technical limit applicable to real equipment.
The vibration signal in this example rises above the fictional reference.
02 / INDUSTRIAL SERVICES
Technical support for the systems that keep your operation running. Each job is defined around your facility's needs.
Fault diagnosis and preventive and corrective maintenance of industrial electrical installations and equipment.
Discuss maintenanceControl system diagnosis and improvement, PLC support, operator interfaces and equipment integration.
Discuss automationSupport for installing, checking and diagnosing sensors, instruments and process signals.
Discuss instrumentationServices are contracted separately. They are not included in the AutoPlant Pulse 30-day trial.
03 / PLANS
Monitoring and technical services have separate scopes. Proposals are based on your equipment, objectives and needs.
An opportunity to evaluate monitoring in the context of your production.
Monitoring designed to become part of your daily operational routine.
Technical work tailored to the conditions and priorities of your facility.
CLEAR ANSWERS
The MTTR, MTBF, OEE, preventive and corrective maintenance, and predictive monitoring views are illustrative concepts. Availability, required data, integration and scope must be confirmed after technical assessment. These examples are not included in the 30-day production monitoring and dashboard trial.
Only AutoPlant Pulse production monitoring and dashboards, within a scope agreed after technical assessment. It does not include maintenance, automation, instrumentation, on-site work or equipment supply.
No. The request starts the commercial discussion. We first assess the process, available signals and technical conditions, then agree on the scope and start date.
Compatibility depends on available signals, equipment and installation conditions. The technical assessment identifies the appropriate data collection method for each case.
Yes. Electrical maintenance, automation and instrumentation can be contracted separately from AutoPlant Pulse, subject to an agreed scope and proposal.
No. The presentation uses demo data only and does not access production APIs. Values are illustrative and do not represent customer results.
After understanding your needs, we define the scope, equipment involved and commercial terms in a proposal. Start the discussion using the form or the business email address when available.
04 / CONTACT
Tell us what you want to monitor or the technical challenge you need to solve.
Email contact is being prepared.
Trial requests are assessed before the 30-day start date is agreed.